


All Products
-
3nh Spectrophotometer
-
Color Spectrophotometer
-
Colour Measurement Spectrophotometer
-
Handheld Color Spectrophotometer
-
Light Box Color Assessment Cabinet
-
Haze Meter
-
Digital Gloss Meter
-
Multi Angle Gloss Meter
-
3nh Colorimeter
-
Color Difference Meter
-
Color Matching Machine
-
Color Matching Software
-
Resolution Test Chart
-
Colour Shade Card
-
Paint Color Cards
-
Fluorescent Tube Light
-
Spectrophotometer Accessories
-
 Eider GranadaThe product and the service was excelent. it came to colombia without many problems (just aduana problems)..supplier 100% recomenmed
 -
Josiah HallEverything was delivered in perfect condition. After assembly, I confirmed operation. Thank you for this product.
-
Mihai PaunescuEverything went as expected and the product arrived in good condition. 3NH is a good supplier and I will definitely use them in the future.
Contact Person :
Melorae
Phone Number :
13925280965
Whatsapp :
+8613925280965
Multi - Functional Resolution Test Chart SineImage YE042 For Digital Cameras / Lenses

Contact me for free samples and coupons.
Whatsapp:0086 18588475571
Wechat: 0086 18588475571
Skype: sales10@aixton.com
If you have any concern, we provide 24-hour online help.
xProduct Details
| Material | High Resolution Photographic Paper | Types | Reflectance |
|---|---|---|---|
| Ratio | 16:9/4:3 | Brand | 3nh |
| Application | For Shading Measurement | ||
| High Light | camera resolution chart,camera lens test chart |
||
Product Description
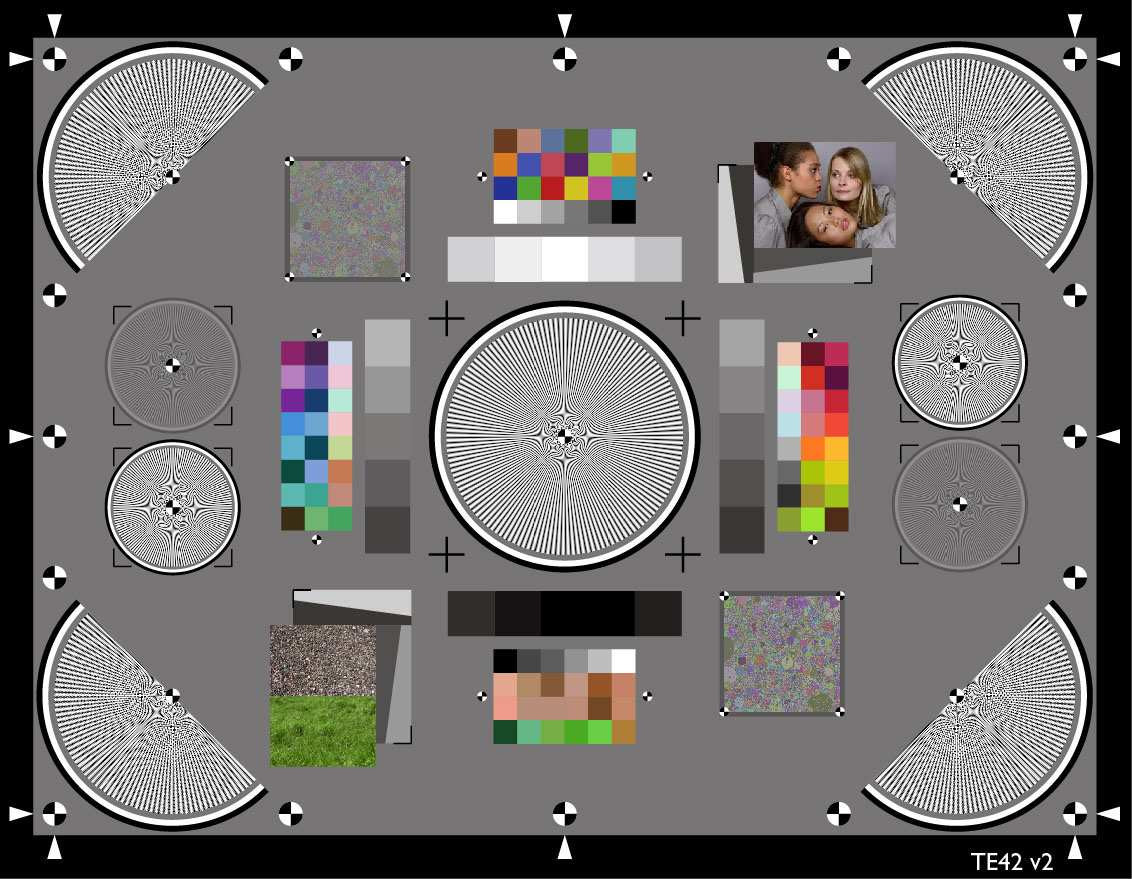
SineImage YE042 Multi-functional Test Chart "Forty Two"
| Model | YE042 |
| Type | Reflectance |
| Size | Custom Designs |
| Ratio | 4:3/16:9 |
| Material | HD photographic paper |
With the new version of the Test Chart “Forty Two” (TE42 Version 2) 3nh / Sineimage improved the successful multi-functional chart for testing digital cameras and lenses: With one single chart OECF (Opto Electronic Conversion Function), dynamic range, resolution, texture loss, shading, distortion, lateral chromatic aberration and color reproduction can be measured according to ISO standards. The chart can be analyzed with the corresponding software (iQ-Analyzer, until version 4 called IE-Analyzer). For analysis please use the individual reference files delivered with your chart.
The chart consists of several components:
OECF
The gray scale, arranged around the central Siemens star, is used to determine the opto electronic conversion function (OECF). It describes how the digital camera transfers luminances into digital values. The patches are analyzed for all three color channels red, green and blue in color images. There are three significant characteristic values derived from the OECF: SNR (relation between signal and noise), Visual Noise (takes into account that the visual perception of noise can be different for observers compared to a mere SNR approach) and Dynamic Range (contrast in a scene reproduced by the digital camera).
![]()
| Patch | |||
| Step | Measured | Reference | Deviation |
| 1 | 0.07 | 0.06 | 0.01 |
| 2 | 0.11 | 0.12 | -0.01 |
| 3 | 0.20 | 0.19 | 0.01 |
| 4 | 0.25 | 0.26 | -0.01 |
| 5 | 0.31 | 0.33 | -0.02 |
| 6 | 0.40 | 0.41 | -0.01 |
| 7 | 0.48 | 0.49 | -0.01 |
| 8 | 0.56 | 0.58 | -0.02 |
| 9 | 0.70 | 0.67 | 0.03 |
| 10 | 0.75 | 0.77 | -0.02 |
| 11 | 0.90 | 0.88 | 0.02 |
| 12 | 0.98 | 1.00 | -0.02 |
| 13 | 1.12 | 1.13 | -0.01 |
| 14 | 1.25 | 1.28 | -0.03 |
| 15 | 1.42 | 1.44 | -0.02 |
| 16 | 1.66 | 1.63 | 0.03 |
| 17 | 1.85 | 1.86 | -0.01 |
| 18 | 2.13 | 2.12 | 0.01 |
| 19 | 2.44 | 2.46 | -0.02 |
| 20 | 3.00 | 3.00 | 0.00 |
| Background | 0.82 | 0.80 | 0.02 |
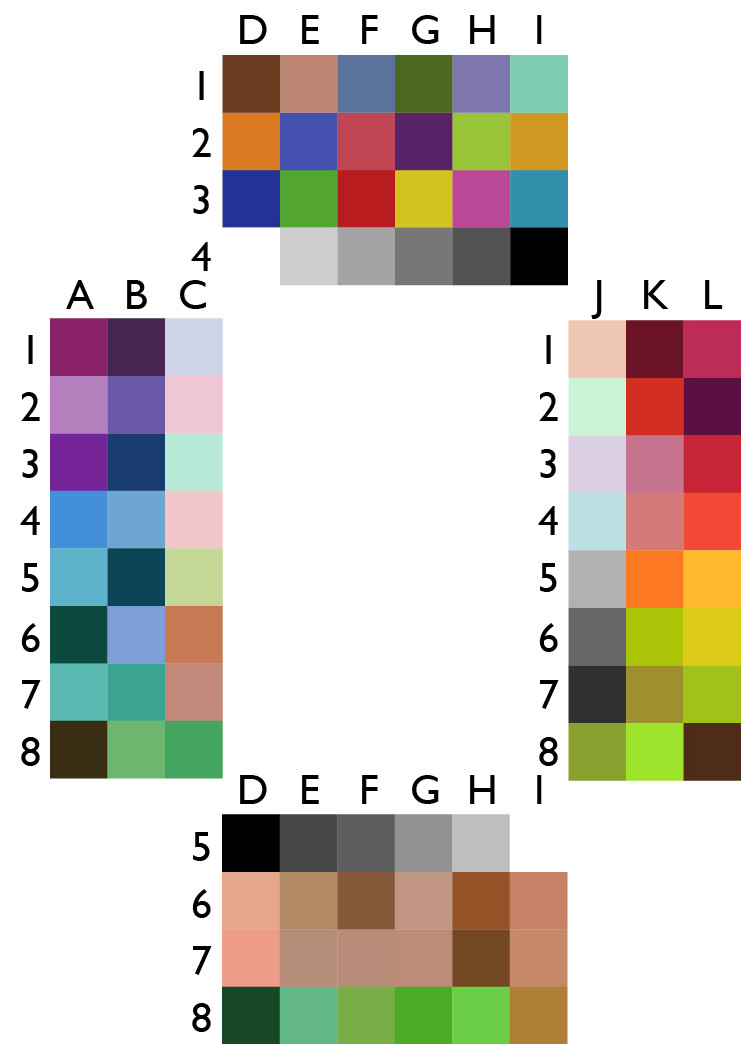
COLOR
The color patches, are arranged in four blocks around the OECF patches. They are based on the X-Rite ColorChecker SG and are used for evaluation of color reproduction. The patches are converted into color coordinates in the CIE L*a*b* color space (represents the color reception of the human visual system). From these values the color distance Delta E, that describes the color
reproduction quality, is calculated.
![]()
![]()
RESOLUTION / SIEMENS STARS
Resolution is measured in the center and the image corners using sinusoidal Siemens stars. There are 5 stars, one in the center and four half stars in the corners of the target. The stars are divided into segments and the resolution is measured for each of them. There are eight segments for the center star and three for each of the corner stars. Finally the mean value of the segments for each star and additionally for the corners, the mean value of all four stars gets reported.
![]()
Two pairs of Siemens stars are included on the left and the right side of the chart. Each pair consists of one Siemens star with 100% modulation and one low contrast star with 20% modulation.
![]()
RESOLUTION / SLANTED EDGES
Two subcharts, each with a horizantal and a vertical edge, are included in the Forty-Two. The resolution is determined for each slanted edge.
![]()
TEXTURE LOSS
The analysis of the dead leaves pattern delivers a MTF. Shading describes the loss of light from the center of an image to the corner and is measured using the gray background.
The metric 'texture loss' describes the treatment of fine details with low contrast by an imaging system. The dead leaves structure is developed to assess this phenomenon.
It is made of circels in all sizes and colors at a limited contrast level. A fourier transform of an image of this structure taken with a camera provides the power spectrum that the camera is able to reproduce. In 2014 the dead leaves structure and the analysis were improved by Image Engineering.
The Forty-Two version 2 contains two patches of the latest dead leaves developement at different contrast levels.
![]()
The analysis of the dead leaves pattern delivers a MTF.
SHADING
Shading describes the loss of light from the center of an image to the corner and is measured using the gray background.
DISTORTION
Distortion is an geometrical aberration caused by the lens that results in a variation of the scale over the image height. Original straight lines look curved. Distortion is measured by using the marks. This structure is also used to determine the lateral chromatic aberration. A scale factor depending on the wavelength of the light that results in color fringes around high contrast structures in the corners of an image.
![]()
VISUAL APPRAISAL
For a visual appraisal of reproduction of details, structures and skin tones in the digitalization process several patches are included in the Forty-Two.
![]()
![]()
Recommended Products