


All Products
-
3nh Spectrophotometer
-
Color Spectrophotometer
-
Colour Measurement Spectrophotometer
-
Handheld Color Spectrophotometer
-
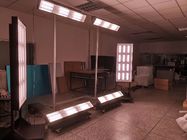
Light Box Color Assessment Cabinet
-
Haze Meter
-
Digital Gloss Meter
-
Multi Angle Gloss Meter
-
3nh Colorimeter
-
Color Difference Meter
-
Color Matching Machine
-
Color Matching Software
-
Resolution Test Chart
-
Colour Shade Card
-
Paint Color Cards
-
Fluorescent Tube Light
-
Spectrophotometer Accessories
-
 Eider GranadaThe product and the service was excelent. it came to colombia without many problems (just aduana problems)..supplier 100% recomenmed
 -
Josiah HallEverything was delivered in perfect condition. After assembly, I confirmed operation. Thank you for this product.
-
Mihai PaunescuEverything went as expected and the product arrived in good condition. 3NH is a good supplier and I will definitely use them in the future.
Contact Person :
Melorae
Phone Number :
13925280965
Whatsapp :
+8613925280965
Digital Camera Grey Scale OECF Measurement Test Chart TE269 OECF36 RoHS Approval

| Place of Origin | Shenzhen, China |
|---|---|
| Brand Name | SineImage |
| Certification | CE&RoHS&TUV&FCC&ISO9001 |
| Model Number | COLOR CAMERA GRAY SCALE TEST CHART |
| Minimum Order Quantity | 1pc |
| Packaging Details | Standard Export Package |
| Delivery Time | within 3-5 working days after payment confirmed |
| Payment Terms | T/T,Paypal |
| Supply Ability | 1000pcs/month |
Contact me for free samples and coupons.
Whatsapp:0086 18588475571
Wechat: 0086 18588475571
Skype: sales10@aixton.com
If you have any concern, we provide 24-hour online help.
xProduct Details
| Brand | SineImage | Usage | Use A Screening To Form The Gray Levels |
|---|---|---|---|
| Light Source | Can Be Equiped With Light Box | Standard | ISO 14524 |
| Model | TE269 | Value | Luminance And Density Data |
| High Light | camera resolution chart,camera lens test chart |
||
Product Description
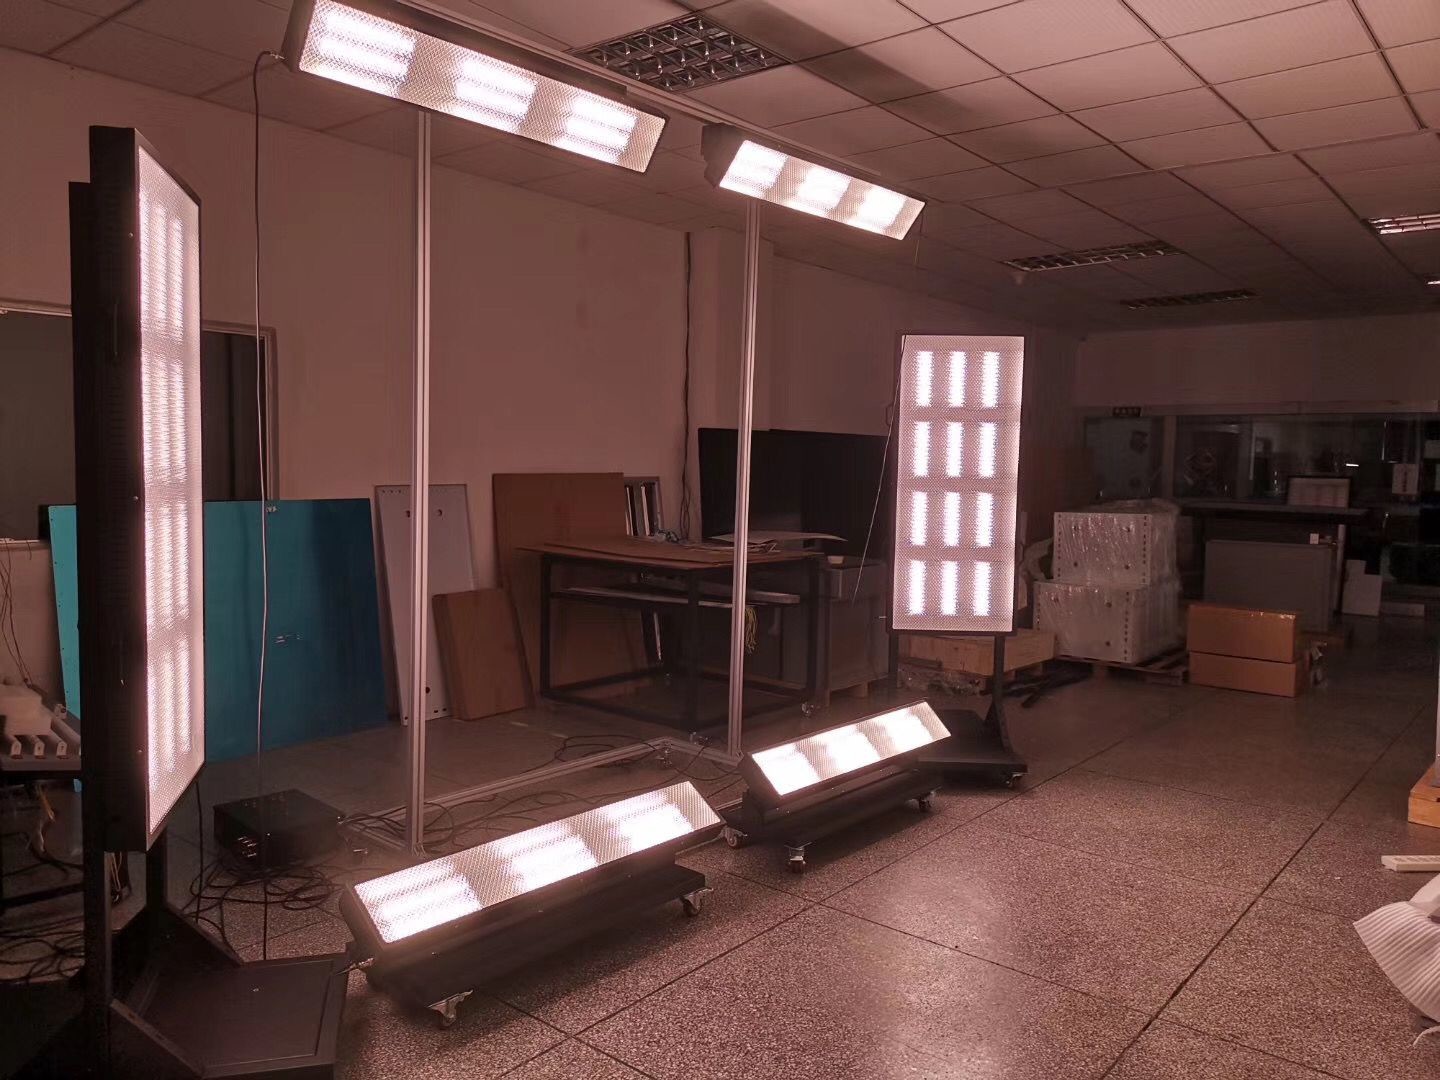
digital camera grey scale OECF measurement test chart TE269 OECF36 1.000.000:1
OECF MEASUREMENT
The opto electronic conversion function (described in ISO 14524) is one the most important characteristics of a digital camera. It describes how the camera transforms luminance values of an object or illuminance values on the sensor plane into digital code values in the digital image.
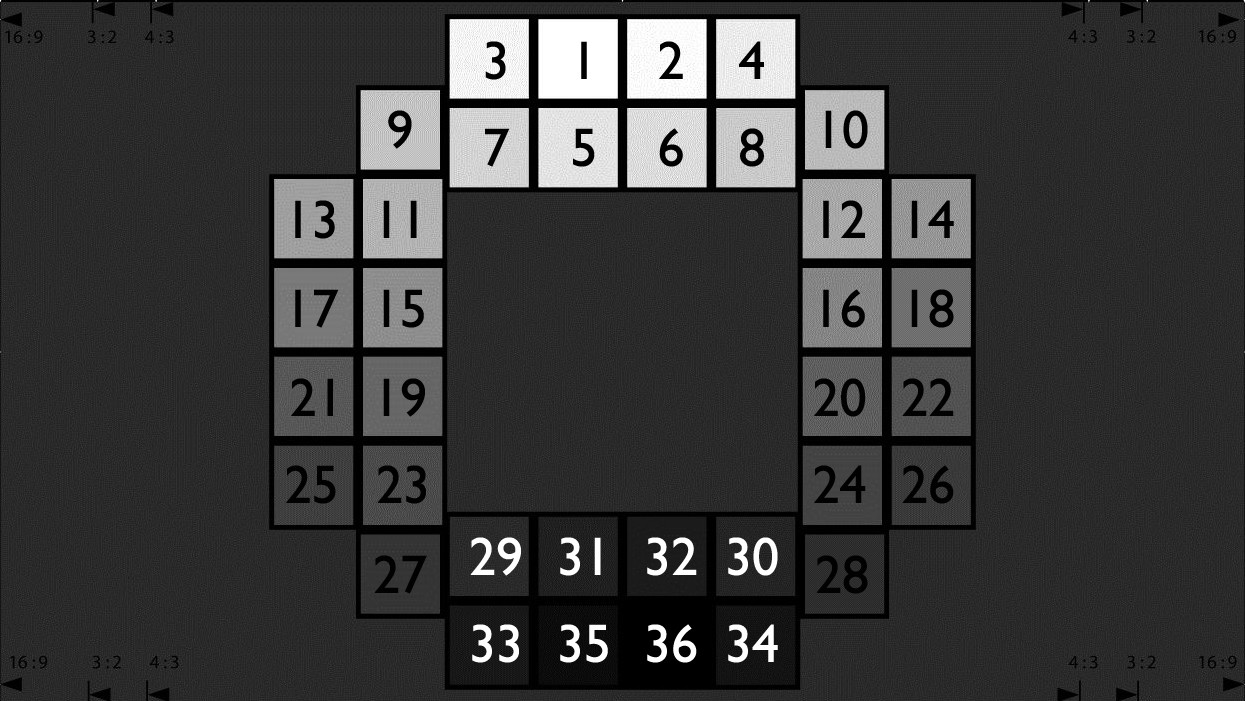
The OECF is typically measured from a grey scale. Depending on the type of camera different versions of test charts are used. The specification of TE264 D is derived from ISO 14524. It is a test chart with a circular arrangement of the grey levels. These may be affected by lens and camera related shading but since most optical systems are rotationally symmetric they will fall on the same shading level for all patches.
ISO 14524 describes how the densities to manufacture the chart are calculated. The values depend on the desired dynamic range of the chart. In order to measure a camera the contrast of the chart should exceed the dynamic range of the camera under test. This is the reason why typical contrast ranges of today’s targets are 10.000:1 and sometimes even more than 1.000.000:1. Although there are still charts with 12 gray steps and less available, we recommend using at least the TE 264 with 20 patches to have enough supporting points for the calculation. The standard version of TE264 uses a screening to form the gray levels. This may lead to increased noise levels or artefacts in the images of high resolution cameras that can resolve the screening. To avoid this problem the chart should fit a limited image height and/or the cameras may, in contrast to the procedure defined in the standard, be slightly defocused. TE 264X is available that uses continuous tone film and therefore does not show this problem.
An integrating sphere like the LE6 provides the best uniformity for the illumination of the OECF targets. Although the targets usually come with density levels and the integrating sphere has a build in illuminance meter we recommend to use a luminance meter in combination with the charts because the conversion to luminances from densities and illuminances requires a calibration factor. A low cost but accurate device is the Gossen Mavo Monitor.
Note: Do not use a teleluminance meter for the measurements!!! These devices are affected by stray light and do not deliver accurate values for the dark patches!!!
The measured values for the patches can be used to create your specific reference file for the evaluation in the iQ-Analyzer. To type in the values use the “Luminance and Density Data” button in the advanced settings of the OECF module.
Images taken from a single gray scale target can be used to answer all of the following questions:
» What is the maximum contrast in a scene that can be captured by the camera in all its tonal details (dynamic range)?
» Is the white balancing o.k.?
» Does the camera use all possible digital values in the image?
» Is there a gamma or tonal correction applied to the captured linear image?
» What is the signal to noise ratio for different grey levels?
» What is the ISO speed of the camera?
Related Chart:
![]()
![]()
![]()
About Us:
![]()
Contact Information:
Contact Person: Clara Liu;
Email: L001@3nh.com;
Wechat & Whatsapp ID: +8613510310267;
Skype: clara.3nh
Recommended Products