


All Products
-
3nh Spectrophotometer
-
Color Spectrophotometer
-
Colour Measurement Spectrophotometer
-
Handheld Color Spectrophotometer
-
Light Box Color Assessment Cabinet
-
Haze Meter
-
Digital Gloss Meter
-
Multi Angle Gloss Meter
-
3nh Colorimeter
-
Color Difference Meter
-
Color Matching Machine
-
Color Matching Software
-
Resolution Test Chart
-
Colour Shade Card
-
Paint Color Cards
-
Fluorescent Tube Light
-
Spectrophotometer Accessories
-
 Eider GranadaThe product and the service was excelent. it came to colombia without many problems (just aduana problems)..supplier 100% recomenmed
 -
Josiah HallEverything was delivered in perfect condition. After assembly, I confirmed operation. Thank you for this product.
-
Mihai PaunescuEverything went as expected and the product arrived in good condition. 3NH is a good supplier and I will definitely use them in the future.
Contact Person :
Melorae
Phone Number :
13925280965
Whatsapp :
+8613925280965
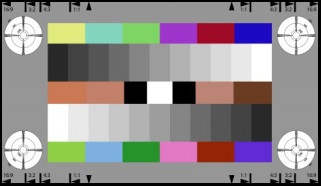
Calibration Resolution Test Chart 0.45 gamma Designed To Color Align Hd Cameras
| Place of Origin | Shenzhen, China |
|---|---|
| Brand Name | SineImage |
| Certification | CE&RoHS&TUV&FCC&ISO9001 |
| Model Number | COLOR CAMERA GRAY SCALE TEST CHART |
| Minimum Order Quantity | 1pc |
| Packaging Details | Standard Export Package |
| Delivery Time | within 3-5 working days after payment confirmed |
| Payment Terms | T/T,Paypal |
| Supply Ability | 1000pcs/month |

Contact me for free samples and coupons.
Whatsapp:0086 18588475571
Wechat: 0086 18588475571
Skype: sales10@aixton.com
If you have any concern, we provide 24-hour online help.
xProduct Details
| Brand | 3nh | Gray Background | D≈0.62, Remission=24% |
|---|---|---|---|
| Standard | HDTV Standard ITU-R BT.709 | Model | TE256 |
| Circular Lines | 400, 600 And 1200 Lines | Gamma | 0.45 |
| High Light | camera resolution chart,camera lens test chart |
||
Product Description
Designed to Color Align HD Cameras COLOR AND CALIBRATION TEST CHART
The TE256 is designed to color align HD cameras.
Two 11-graduated counter current gray scales are arranged on a gray background (D≈0.62, remission=24%), the gray scale being graduated logarithmically. Related to the densities of the gray scales: gamma = 0.45, related to the remission values (brightness): gamma = 2.2, that being exactly the reciprocal value of 0.45. The gamma factor 0.45 applies to remission > 1.8% (brightest step 100%). Between 0 and 1.8% the gamma function shows a linear progression (with the factor 4.5). The darkest step is in this area. The gamma function corresponds to Rec. 709. The output of an optimally gamma-corrected camera yields two 11- graduated counter current linear step signals (see figure below). The dynamic range of the gray scales is 63:1.
| field | 1 | 2 | 3 | 4 | 5 | 6 | 7 | 8 | 9 | 10 | 11 | BG |
| density | 0.05 | 0.14 | 0.23 | 0.33 | 0.45 | 0.58 | 0.73 | 0.91 | 1.14 | 1.43 | 1.85 | 0.62 |
Reference density values of the gray scale
![]()
two 11-graduated counter current linear step signals without color signals
The six color patches of the upper line represent the three primary colors red (R), green (G) and blue (B) as well as the three secondary colors cyan (C), magenta (M) and yellow (Y) according to the HDTV standard ITU-R BT.709 . Since it is impossible to depict the 100% saturated colors on a reflectance chart, the saturation is reduced to the maximum color space of the printer.
The six color patches of the lower line (yellow/green, blue, green, pink, red, magenta) represent the colors between the primary colors.
In addition to the gray scales and color patches for patches with skin tones are located.
| L | a | b | X | Y | Z | R'709 | G'709 | B'709 | Y'709 | C'B709 | C'R709 | ||
| Upper row | Y | 84.54 | -15.01 | 48.18 | 0.59 | 0.65 | 0.25 | 0.88 | 0.81 | 0.38 | 191 | 78 | 140 |
| C | 56.09 | 31.23 | 38.03 | 0.32 | 0.24 | 0.08 | 0.79 | 0.36 | 0.20 | 112 | 99 | 178 | |
| G | 69.76 | -32.54 | 43.76 | 0.31 | 0.40 | 0.14 | 0.54 | 0.68 | 0.26 | 152 | 85 | 117 | |
| M | 69.18 | -24.81 | -11.15 | 0.32 | 0.40 | 0.49 | 0.42 | 0.67 | 0.67 | 151 | 135 | 100 | |
| R | 57.31 | 26.01 | 27.38 | 0.32 | 0.25 | 0.12 | 0.77 | 0.39 | 0.28 | 118 | 106 | 171 | |
| B | 63.64 | -9.15 | -28.86 | 0.30 | 0.32 | 0.57 | 0.41 | 0.58 | 0.75 | 138 | 151 | 108 | |
| Skin tones | Skin 1 | 70.45 | -38.85 | 24.55 | 0.30 | 0.41 | 0.24 | 0.44 | 0.70 | 0.42 | 154 | 103 | 102 |
| Skin 2 | 3.95 | 0.31 | -1.21 | 0.01 | 0.01 | 0.01 | 0.01 | 0.00 | 0.00 | 17 | 128 | 129 | |
| Skin 3 | 94.02 | -0.86 | -3.49 | 0.85 | 0.85 | 0.9 | 0.99 | 0.90 | 0.91 | 218 | 126 | 138 | |
| Skin 4 | 61,95 | 35.55 | 0.51 | 0.41 | 0.30 | 0.30 | 0.85 | 0.41 | 0.52 | 128 | 129 | 175 | |
| Lower row | yellow | 29.43 | 51.23 | 33 | 0.12 | 0.06 | 0.01 | 0.53 | 0.00 | 0.02 | 41 | 116 | 188 |
| blue | 57.96 | 20.8 | 19.35 | 0.31 | 0.26 | 0.16 | 0.73 | 0.42 | 0.34 | 121 | 111 | 164 | |
| green | 29.62 | 42.15 | 42.67 | 0.11 | 0.06 | 0.01 | 0.50 | 0.03 | 0.00 | 44 | 113 | 180 | |
| pink | 19.71 | 41.41 | -66.68 | 0.06 | 0.03 | 0.26 | 0.08 | 0.03 | 0.52 | 32 | 182 | 129 | |
| red | 31.15 | 18.03 | 26.22 | 0.09 | 0.07 | 0.02 | 0.39 | 0.17 | 0.06 | 61 | 110 | 154 | |
| magenta | 33.11 | 45.2 | -51.37 | 0.14 | 0.14 | 0.31 | 0.39 | 0.11 | 0.56 | 60 | 172 | 155 |
Reference Lab and RGB data of the 12 color patches and four skin tone patches
Horizontal and vertical resolution wedges are positioned in circles in the four corners of the test chart. Scaling lines are shown at the outer circular lines (400, 600 and 1200 lines). In addition, cross-color interferences as well as the effects of notch filters and comb filters can be observed.
![]()
![]()
![]()
![]()
About Us:
![]()
Contact Information:
Contact Person: Clara Liu;
Email: L001@3nh.com;
Wechat & Whatsapp ID: +8613510310267;
Skype: clara.3nh
Recommended Products